
Lesson 7 – T: Transform Your Learning: How Do We Match Solar Supply to Energy Demand in a Mini-Grid?
T: Transform Your Learning
Make a Recommendation When Supply and Demand Do Not Match
In real engineering, systems are often limited by money, space, weather, or available equipment. That means the first design does not always work perfectly. Engineers then decide what to change.
Look at the clinic example again with additional loads.
Mini-Grid Data Demand Table (Load Profile)
|
Load Name/Device |
Quantity (Number of Devices) |
Power Per device (W) |
Hours Per Day |
Daily Energy |
|---|---|---|---|---|
|
LED exam room lights |
4 |
10 |
6 |
4 x 10 x 6 = 240 |
|
Ceiling fans |
2 |
60 |
8 |
2 x 60 x 8 = 960 |
|
Vaccine refrigerator |
1 |
120 |
10 |
1 x 120 x 10 = 1200 |
|
Phone charging station |
1 |
100 |
3 |
1 x 100 x 3 = 300 |
|
Water pump |
1 |
400 |
2 |
1 x 400 x 2 = 800 |
|
Laptop charging area |
3 |
65 |
4 |
3 x 65 x 4 = 780 |
|
Night security light |
2 |
20 |
10 |
2 x 20 x 10 = 400 |
|
Additional fans |
2 |
60 |
8 |
2 x 60 x 8 = 960 |
|
|
|
|
Total daily demand |
5,640 Wh |
Mini-Grid Daily Supply Table (Solar Production)
|
Panel Power (W) |
Number of Panels |
Sun-hours Per Day |
Daily Solar Energy (Wh) |
|---|---|---|---|
|
250 |
4 |
5 |
250 x 4 x 5 = 5000 Wh |
Explain with Evidence:
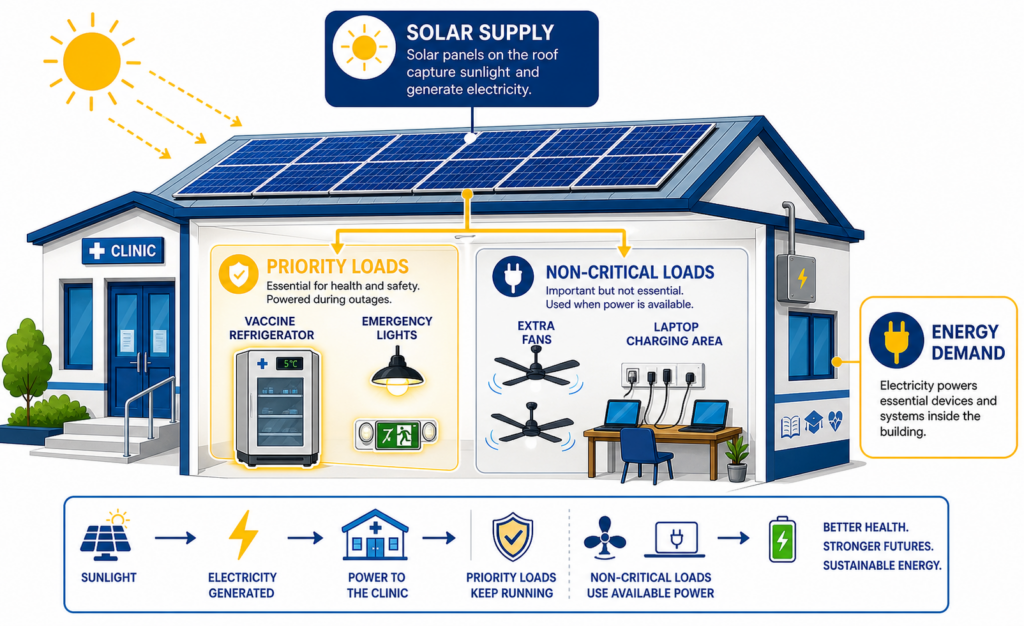
The system no longer makes enough daily energy, engineers could choose one or more of these changes:
- Add panels
- Reduce run-time
- Remove a noncritical load
- Protect priority loads first
- Move some device use to daytime only
Engineering Notebook
How did you decide whether the system could meet the need? If it could not, what change did you recommend and why?
Check Your Understanding
- What is the difference between power and energy?
- How do you calculate daily energy demand?
- How do you estimate daily solar supply?
- What does it mean when demand is greater than supply?
- What trade-off did you recommend to fix the supply/demand issue.
Closure: Connecting Lesson 7 to Lesson 8
In this lesson, you compared daily solar supply with daily energy demand and used trade-offs to improve a mini-grid design. In the next lesson, you will explore what happens when sunlight is not available and how batteries help solar systems stay useful and reliable over time.
Final Takeaway
Engineers use load profiles and daily supply tables to compare how much energy people need with how much solar power a system can produce in a day. If demand is greater than supply, they must revise the design by adding capacity or reducing less important loads so the system can meet real-world needs.