Lesson 5 – L: Launch Your Learning: How Do Solar Cells Turn Light into Power?
L: Launch Your Learning
Measure a Solar Cell Under Different Light Conditions
Now you put the ideas to work. Working with a partner, you will connect a solar cell to a multimeter, then measure its voltage and current under several light conditions and calculate the power for each. Record everything in your data table — your measurements are your evidence.
What You Will Do
|
Step |
What You Do |
What You Are Looking For |
|---|---|---|
|
1. Connect for voltage |
Attach the solar cell to the meter leads as your kit directs; measure the open-circuit voltage in your first light condition and record it. |
A positive DC voltage in bright light. |
|
2. Measure current with a load |
Connect a small load as directed, set the meter to read current, and record the value. |
A current reading in A or mA, with the right units. |
|
3. Calculate power |
For each condition, compute P = V × I and record it in watts. |
A power value for each light condition. |
|
4. Change the condition and repeat |
Change the light — move the lamp closer or farther, tilt the cell, or shade part of it — and measure again. |
How V, I, and P change as the condition changes. |
Your Solar Cell Data Table
You will fill in a table like this one. Record voltage and current for each condition, then calculate the power.
|
Condition |
Voltage (V) |
Current (A or mA) |
Power (W = V × I) |
|---|---|---|---|
|
Bright light / lamp close |
|
|
|
|
Medium light |
|
|
|
|
Low light / lamp farther |
|
|
|
|
Partial shading |
|
|
|
Pause and Think
After your first two conditions: which changed more when the light got weaker — the voltage or the current? What does that tell you about why the power changed?
From Your Data to a Real Mini-Grid Decision
A single measurement is a start, but engineers reason about a whole system across a whole day. Use your data to see the pattern: which condition produced the most power, and how power fell as light weakened, the cell tilted away, or part of it was shaded.
Turn that pattern into a claim you can defend. Write one or two “If…, then…” statements straight from your numbers — for example, “If the panel is shaded by half, then power drops from ___ W to ___ W.” A claim backed by your own measurements is evidence, not just an opinion.
|
Question to Analyze |
What to Look For In Your Data |
|---|---|
|
Highest power |
Which light condition gave the most power? Why might that be? |
|
Effect of weaker light |
How did power change as light got weaker or the cell tilted away? |
|
Effect of shading |
How much did partial shading lower the power compared with full light? |
|
Real-world limit |
What times of day or weather would limit a community’s solar power? |
Key Idea
A solar cell’s output depends on sunlight conditions — brightness, angle, and shading. Because that output varies, engineers must design solar systems to account for it, rather than assuming the panels always deliver their best.
Explain With Evidence
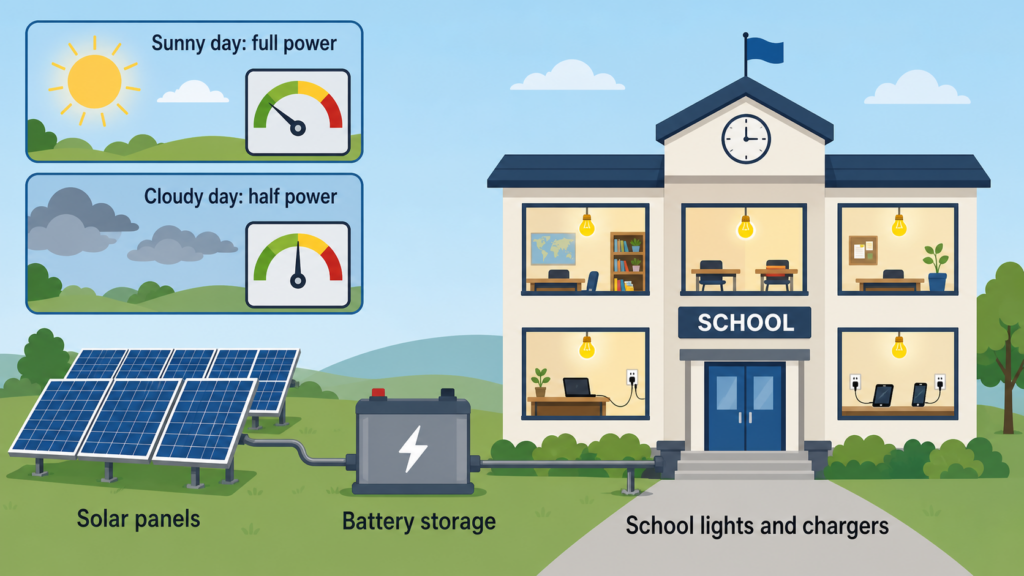
A school mini-grid runs on a small solar array and a battery. On sunny days the panels power lights and phone charging; on cloudy days they make only about half as much. Based on your data, what could engineers or staff do to keep enough energy on cloudy days — and what trade-off does your idea accept?