
Lesson 7 – L: Launch Your Learning: How Do We Match Solar Supply to Energy Demand in a Mini-Grid?
L: Launch Your Learning
Comparing a Load Profile (Demand) to Daily Solar Production (Supply)
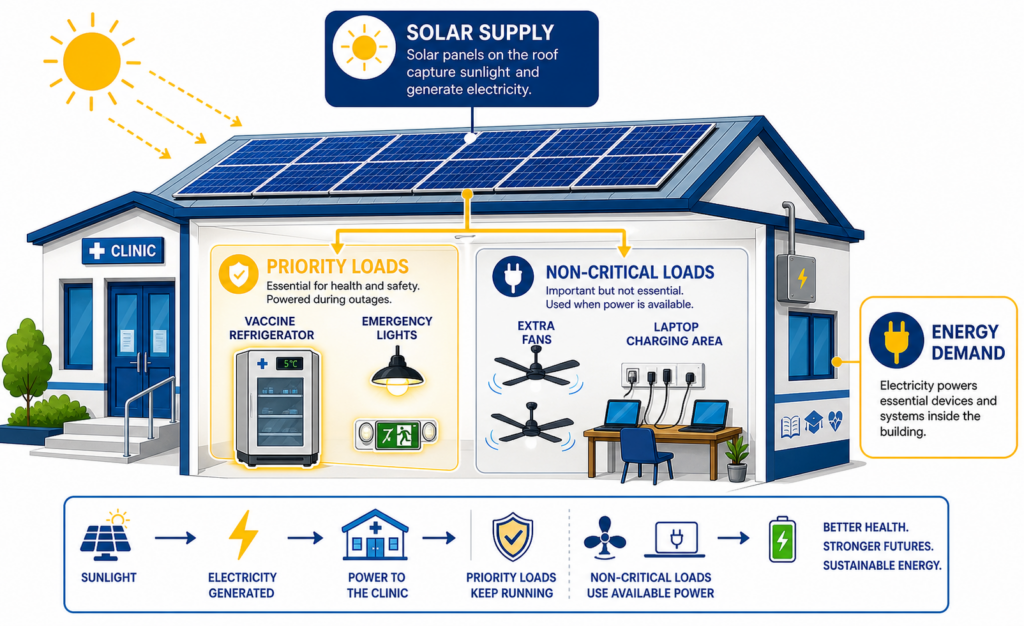
Load Profiles and Supply Tables
When engineers design a solar mini‑grid for a real school, clinic, or neighborhood, they start by building a load profile. This is a detailed list of every device that will use electricity (lights, fans, computers, chargers), how much power each one needs (in watts), how many of them there are, and how many hours they run in a typical day. From that table, they calculate daily energy demand for each device and then add them up to find the total daily energy the community needs.
Next, they create a daily supply table for the solar panels. They list the panel power rating, how many panels are installed, and how many sun‑hours the site gets. Using those values, they estimate daily solar energy supply for the whole system. By comparing the total demand (from the load profile) with the total supply (from the daily supply table), engineers can see if the design is likely to work or if it will fall short. If demand is greater than supply, they have to make trade‑offs: add more panels, reduce run‑time on some devices, remove non‑critical loads, or protect priority loads like clinic refrigerators and emergency lighting first.
In other words, load profiles and daily supply tables are planning tools. They turn a vague idea like “power a school with solar” into specific numbers so engineers can answer questions such as:
- Will this system meet the school’s needs on a typical day?
- Which devices use the most energy over time?
- What changes are needed to keep critical loads running when energy is limited?
To Create a Load Profile:
- List each load in the mini-grid scenario.
- Calculate daily energy for each load using power × hours.
- Add the loads to find total daily demand.
- Estimate daily solar supply using: panel power × number of panels × sun-hours.
- Compare demand and supply.
- Decide whether the system is likely to meet the need.
Mini-Grid Data Demand Table (Load Profile)
|
Load Name/Device |
Quantity (Number of Devices) |
Power Per Device (W) |
Hours Per Day |
Daily Energy (Wh) |
|---|---|---|---|---|
|
|
|
|
|
|
|
|
|
|
|
|
|
|
|
|
|
|
|
|
|
|
|
|
|
|
|
|
|
|
|
|
|
|
|
|
|
|
|
|
|
|
|
|
|
|
Total daily demand |
|
To Create a Supply Table:
- Write the panel power rating in watts for each panel type.
- Write how many panels of that type are in the system.
- Write the number of sun-hours per day for the site.
- Multiply panel power × number of panels × sun-hours to find daily solar energy in watt-hours.
- Repeat for each panel group if there is more than one.
- Add all of the daily solar energy values to find the total daily supply.
Mini-Grid Daily Supply Table (Solar Production)
|
Panel Power (W) |
Number of Panels |
Sun-hours Per Day |
Daily Solar Energy (Wh) |
|---|---|---|---|
|
|
|
|
|
|
|
|
|
|
|
|
|
|
|
|
|
|
|
|
|
|
|
|
|
|
|
|
|
|
|
|
|
|
|
|
|
|
Total Daily Supply |
|
Example: Small Clinic
A small clinic wants solar power for:
- 4 LED lights in exam rooms
- 2 ceiling fans in the waiting area
- 1 vaccine refrigerator
- 1 phone‑charging station (multi‑port)
Mini-Grid Data Demand Table (Load Profile)
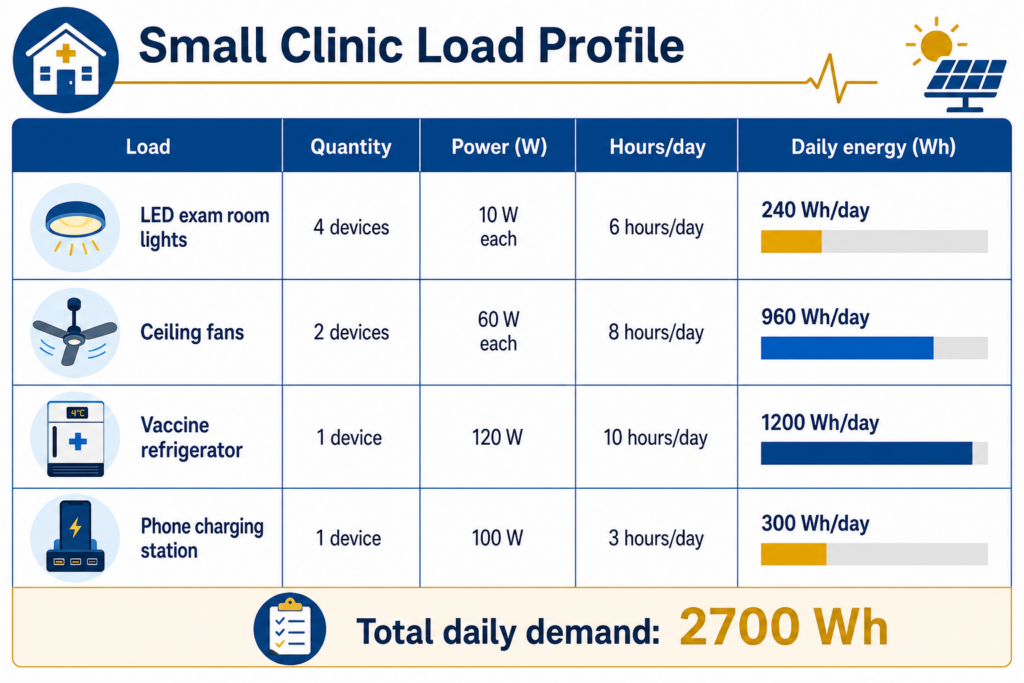
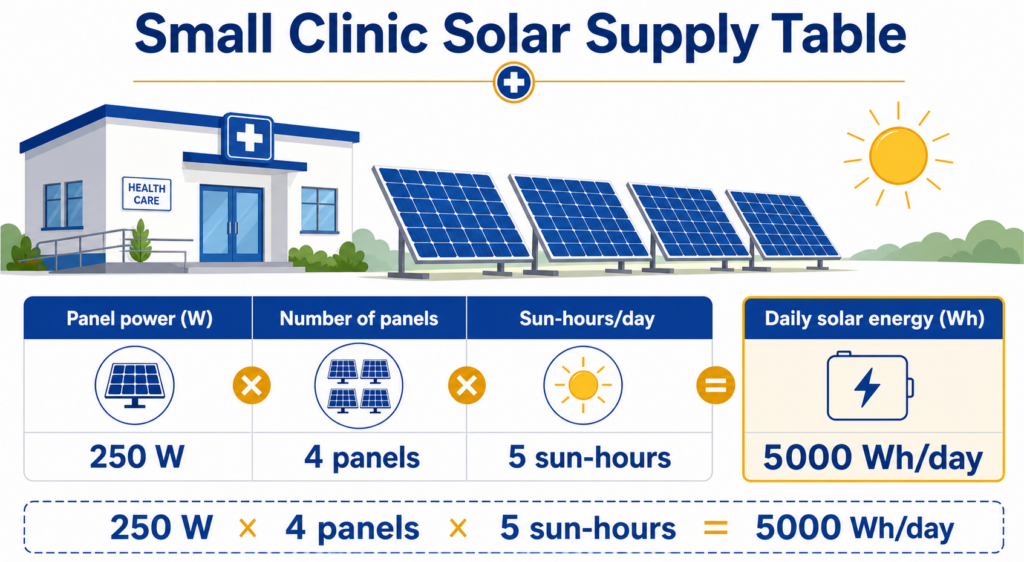
In this example, daily supply (5000 Wh) is greater than daily demand (2700 Wh), so the system is likely to meet the clinic’s needs under typical conditions.
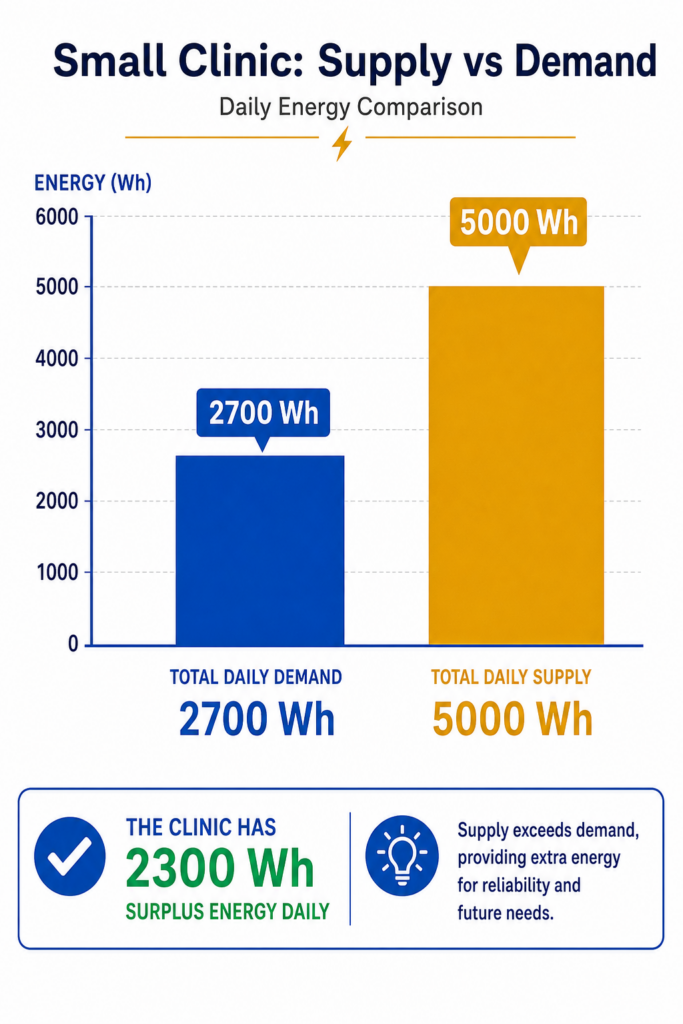
An engineer still needs to consider reliability, weather, battery storage, and constraints like budget or roof area, but the tables show that the basic energy balance works.
Pause and Think
- Are you comparing watts or watt-hours?
- Which load in your list uses the most total energy in a day?
- If demand is greater than supply, what problem does that create?
Key Idea
A solar system must be sized around daily energy use, not just around whether a panel produces power at one moment.